Transforming business collateral into measurable performance
Sponsored by FlipsnackIn business, everything should be measured

From ad performance to lead conversion, from time-to-close to customer lifetime value, you’ve built systems to track it all. Or at least, that’s what you tell yourself.
The truth is, not everything that drives results is being measured. The documents that often carry a company’s story, such as sales decks, brochures, catalogues and client reports, still vanish after they’re sent. Once a presentation leaves the screen or a PDF is shared, it becomes invisible.
For years, that was just how things worked. Collateral was meant to inform and persuade, not to report back. But as marketing budgets grow and expectations rise, the blind spot on how these materials perform has started to matter a lot more.
A part of the story that’s still invisible
According to Nielsen’s 2024 Annual Marketing Report, 84 per cent of marketers say they’re confident in measuring ROI, but only 38 per cent actually measure digital and traditional activity together. That leaves a large portion of the customer experience untracked, especially the part that happens in shared materials.
Part of the problem is structural. Traditional formats such as PDFs or PowerPoint slides were never built for measurement. You can track how many people received a file, but not whether it was opened, read or acted on.
That’s beginning to change. Businesses are now starting to measure engagement at the document level, seeing what people open, how long they stay and what captures attention. It’s a simple shift, but it changes how teams think about their content, from something you just send to something that shows its own results.

When a brochure became a source of insight
At ProMat, one of the largest trade shows in the warehouse and logistics industry, Swedish automation company Radioshuttle faced a familiar challenge. Radioshuttle’s technology was cutting-edge, but its sales materials weren’t. Explaining automated pallet-handling systems through long slide decks and printed brochures took time and often left visitors overwhelmed.
So Radioshuttle tried something new. Each rep carried an iPad with an interactive brochure that brought the company’s systems to life in just a few taps. Visitors could watch how the equipment moved, explore configurations and request specifications on the spot.
The results were immediate. Average viewing time passed 11 minutes per visitor, and engagement grew by more than 600 per cent in the first month. The sales team didn’t just walk away with leads, they walked away with data. They could see which systems drew the most attention and what customers wanted to know more about.
What started as a trade show test became a new way to shape messaging and train distributors. The brochure stopped being a handout and started acting like a feedback loop.

Why measuring content matters everywhere
Radioshuttle isn’t an exception. Businesses in completely different industries are seeing the same shift.
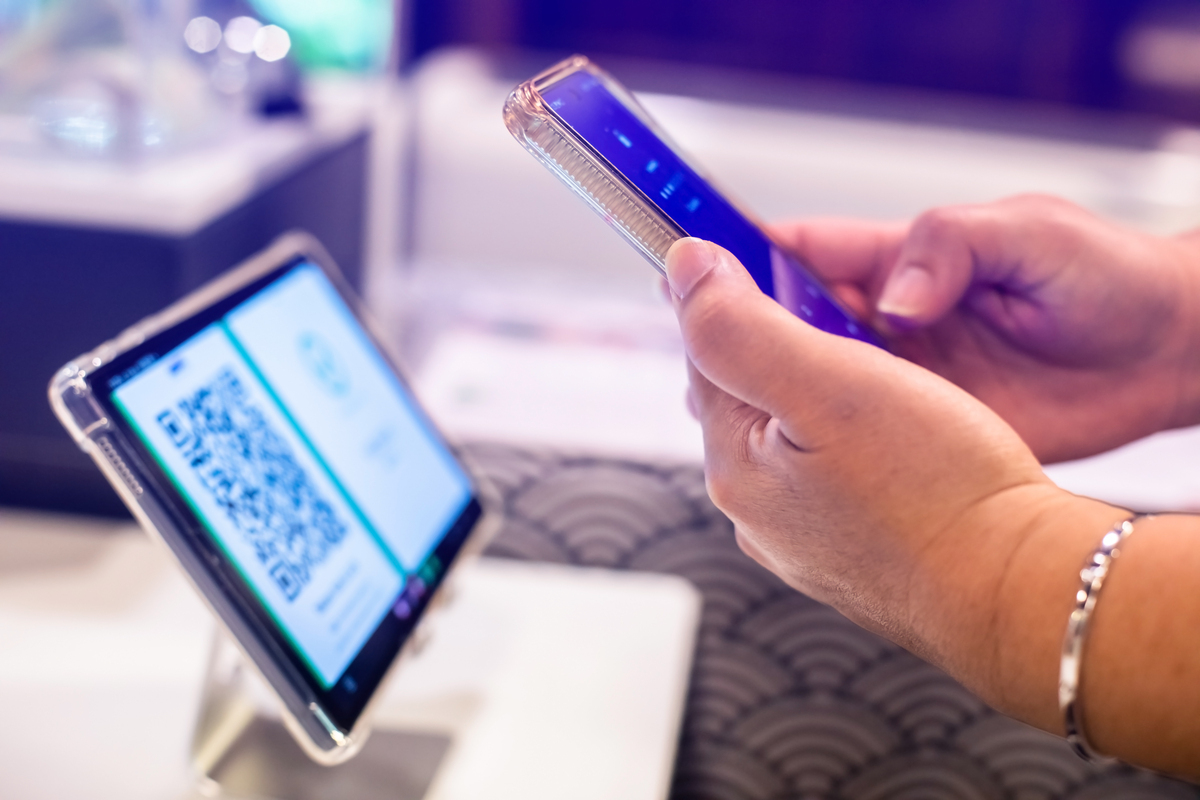
In France, jewellery retailer Pandora replaced printed catalogues with digital ones that could be scanned by customers through QR codes. During its Valentine’s Day campaign, over 2,700 shoppers used the codes in just a few days, spending around two and a half minutes exploring products on their phones. Across 130 stores, operations became about three times faster. Store staff spent less time flipping through binders and more time helping customers, all because the brand could finally see what people actually engaged with.
In B2B, Benifex, which helps organisations manage employee benefits, took a similar step. The marketing team turned reports and guides used as part of their lead-gen efforts into interactive content that tracks reader engagement. They could finally see how far people read and which sections held the most attention. One campaign generated more than 300 qualified leads while cutting production time in half.
A smarter way to think about collateral
For years, collateral was seen as something you make, polish and send. The focus was on design, not data. That made sense when there was no real way to track what happened after a file was shared. But that’s no longer the case.
Now, businesses can treat every brochure, catalogue or sales deck as a living asset, something that not only delivers information but also reports back on its own performance. With tools such as Flipsnack, teams can turn static PDFs into interactive documents that show real engagement data without adding complexity or disrupting workflows.
The result isn’t just better design, it’s better decisions. Marketers know what resonates. Sales teams see what drives conversations. Leaders finally get proof of how content contributes to revenue.
The next big competitive edge won’t come from creating more materials, but from understanding the ones you already have and learning from them.
Flipsnack helps businesses turn PDFs into interactive, trackable content that shows how readers engage, who opens it, how long they spend and what captures attention. Trusted by companies such as Estée Lauder, Electrolux, Pandora and Radioshuttle, Flipsnack helps brands make every document measurable and meaningful.
Learn more at www.flipsnack.com.

Business Reporter Team
Most Viewed
Winston House, 3rd Floor, Units 306-309, 2-4 Dollis Park, London, N3 1HF
23-29 Hendon Lane, London, N3 1RT
020 8349 4363
© 2025, Lyonsdown Limited. Business Reporter® is a registered trademark of Lyonsdown Ltd. VAT registration number: 830519543


