A pragmatic approach to tracking the total cost of quality
Quality is intertwined with most business functions within an organisation, so calculating its impact is not easy – but it can be done

Ask anyone in manufacturing about quality management and they’ll all agree that it’s important. Have them quantify quality efforts and successes, and you’ll likely see them struggle. Despite a clear evolution from error detection to prevention and using data that feeds continuous improvement, many quality leaders find it difficult to assess the quality management function. Even worse, because of the function’s unclear contribution, old beliefs – that quality is nothing more than a cost centre with no value other than detecting off-spec production – often resurface.
The most obvious way to change this perception is by highlighting financial value. Being able to justify how quality contributes to the bottom line will help get management commitment and drive quality innovations. This article outlines a solid financial model that helps quality leaders to systematically track and calculate the impact of good and poor quality.
Full picture or the tip of the iceberg?
Poor quality is not only felt by the quality team. It also affects the entire organisation. And, because quality is intertwined with most business functions, the extent of that impact is not easy to calculate. It becomes even more complicated when considering the invisible side of quality and less obvious costs.
Picture a large iceberg floating in the sea – a fragment of it rising above the water, while the greater part of the iceberg lies hidden in the deep blue. Just like in this famous metaphor, the costs of quality are partly visible and partly hidden. Aspects such as rework and quality control costs are easy to measure and understand, and they are visible to most people. But they are only the tip of the iceberg. On the other hand, less obvious costs hidden underwater represent the biggest share of our total cost of quality and can have a much bigger impact.
For example: all your rework consumes additional energy, leads to excessive wear on your equipment and might demotivate your team with an effect on your staff turnover. Similarly, it’s obvious that quality incidents can lead to customer claims. But the less visible impact on your customer satisfaction, brand image and lost sales is likely to be of a whole different magnitude than the immediate claims.
Good quality versus poor quality
To quantify our quality operation and be sure that we cover all costs of quality we need a more structured approach than this segmentation along the lines of visibility. Val Feigenbaum’s PAF model and his segmentation between good quality and poor quality are a good start for this.
Good quality represents everything you organise proactively for. Poor quality represents all quality incidents and their effects. The costs for both good and poor quality can also be segmented further. Good quality costs are those that go into prevention and appraisal, while poor quality costs can be divided into internal and external failures. You’ll want to track internal and external failure separately since the monetary impact increases drastically the moment your goods leave the factory grounds.
A balancing act
As quality management matures, manufacturers will invest more in prevention than fixing failure. Spending more on good quality will have them spend less on fixing poor quality. Conversely, by investing less in good quality, they’ll need to spend more time and resources on fixing failure. The sum of failure and prevention costs is the total cost of quality.

Figure 1 shows the trade-off between failure and prevention costs. As the graph shows, the quality optimum is where the lines of cost of good quality and cost of poor quality intersect. This is where you achieve the optimal total cost of quality. Spending less or more than this optimum will quickly increase the total cost of quality.
There is no universal optimum – this varies from industry to industry. Your optimum should be the result of deliberate analysis and reflect your strategic considerations regarding quality. It is always a balancing act between the costs of good and poor quality.
A pragmatic approach to the total cost of quality
Breaking down the total cost of quality into the PAF model categories (prevention, appraisal, internal and external failure) will have any mature manufacturer look at more than 30 different quality management activities.

And, while this breakdown helps organisations understand the depth of their quality management, analysing data for each of these activities is impractical. To make this financial model more practical, divide your quality management activities into three to five bigger topics per category:
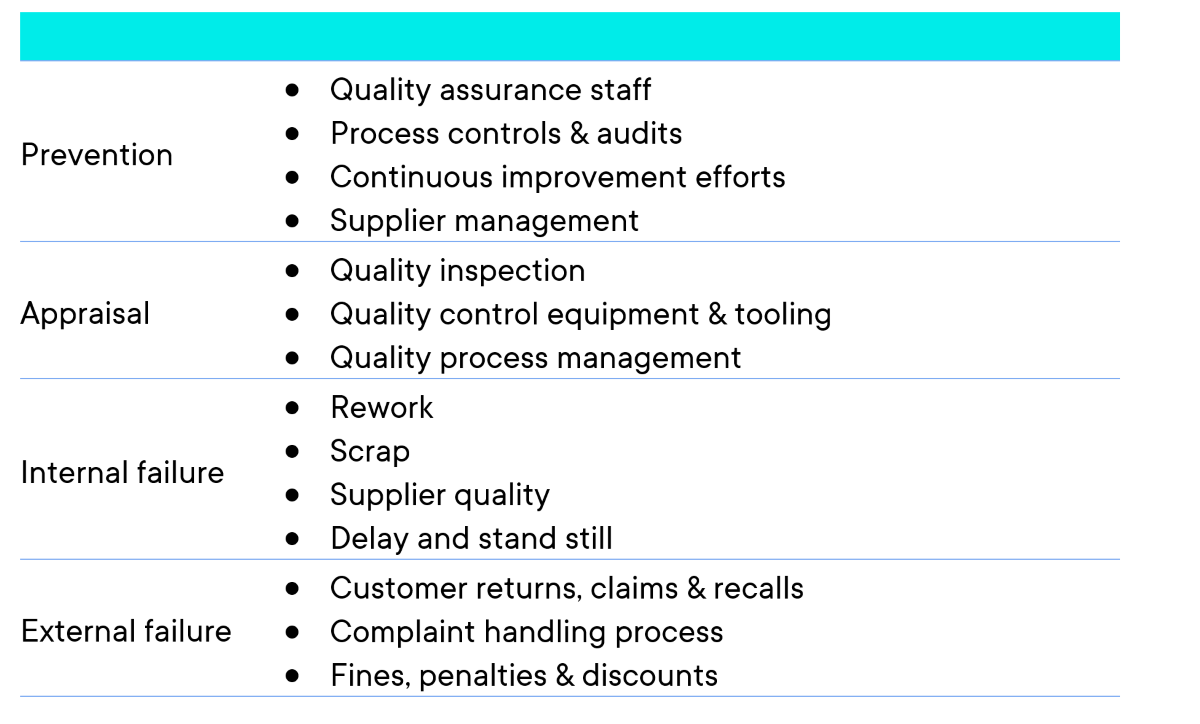
This division helps provide sufficient information on the distribution of costs and helps quality leaders build a solid business case for quality management.
Recommendations
Deploying a total cost of quality model, quality leaders are using an effective cost management tool that translates the impact of quality into hard cash. While it’s not easy to quantify that impact, here are a few useful recommendations:
- Looking back at the PAF model, quantify each quality management activity
- Work with a standard unit price for every risk assessment, every customer complaint and every audit
- Use industry benchmarks to help assign monetary value when building your business case
- Use an ROI calculator to validate the impact of quality-related investments
- Use a digital quality management system (eQMS) to enjoy immediate insights into quality and lower the cost of quality
- Automating recurring tasks, having the right reports at your fingertips, triggering automatic alarms and being able to provide audit-data at the touch of a button are all examples of how a good eQMS can help lower costs
- Similarly, you can lower the cost of poor quality by detecting anomalies earlier and the ability to respond faster to errors as they occur
To find out more, please visit the AlisQI website
By Gerben de Haan, Chief Product Officer and co-founder, AlisQI

Business Reporter Team


Most Viewed
Winston House, 3rd Floor, Units 306-309, 2-4 Dollis Park, London, N3 1HF
23-29 Hendon Lane, London, N3 1RT
020 8349 4363
© 2025, Lyonsdown Limited. Business Reporter® is a registered trademark of Lyonsdown Ltd. VAT registration number: 830519543